🔎 Quick Dive: How much microscopic pollution do we breath in?
🔎 Quick Dive: How much microscopic pollution do we breath in?
Measuring the levels of PM 2.5 pollution in our lungs.

What would our air pollution look like if you could see it with the naked eye?
Looking back, I consider myself lucky not to have been brought up in London for very long, I yearn for the open fields, creeks and fresh air that I spent my time around as a kid. I was born in London and spent 7 years there before leaving, enough time to have felt the effects of stunted lung growth according to a six year study on air pollution.
In December 2020, a landmark ruling was made that admitted “exposure to excessive air pollution” had contributed to the death of 9 year old Ella Kissi-Debrah in Lewisham.
The city’s level of NO2, PM 10 and PM 2.5 had been consistently above the legal limits for toxic particles suggested by the World Health Organisation. The ruling was important as it directly attributed the city’s failure on air pollution as a possible cause of death.
Six years on from Ella’s death and I found myself back in London making the commute across trains, buses and traffic jams that thousands of others make every day - breathing in the city.
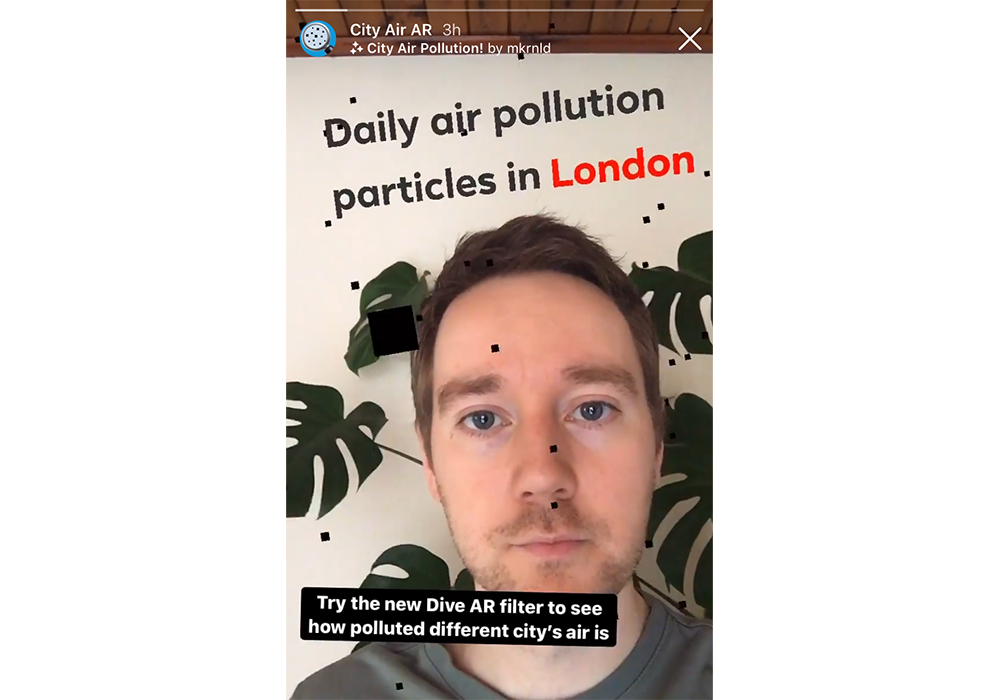
I’ve been working on this idea for some time now, a simple way to visualise some of the pollutants we breathe in daily but first needed to get my head around the science.
Try the AR filter out on The Dive’s instagram page here.
What is PM?
Particulate Matter (or PM) is a term to describe a collection of microscopic clumps of varying size and shape which have combined together to form dangerous particles that can be inhaled. There is no fixed term for what constitutes Particulate Matter as its breakdown is dependent on when and where it is found; but it can be roughly split into a few categories - dust, dirt, soot, smoke and droplets of liquid.
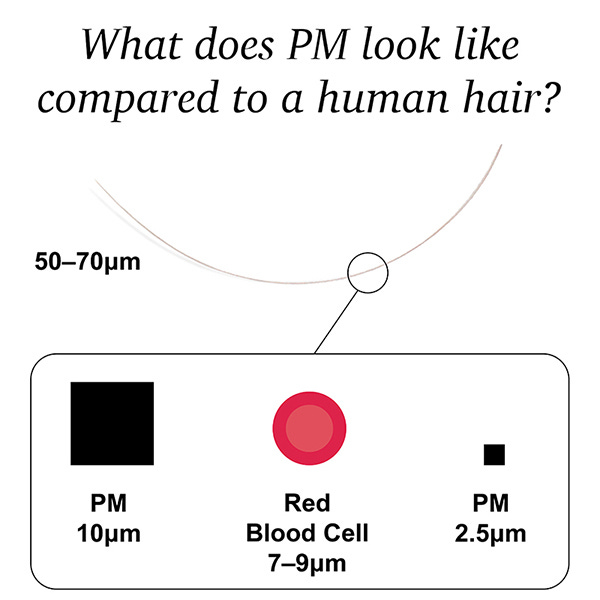
PM 2.5 and 10 refer to, in microns (μm), the diameter of the particle. With PM 10μm being roughly 5-7 times smaller than an average human hair in diameter and PM 2.5μm being about 4 times smaller than that.
Whilst PM 10 often deposits in the nose or throat as we inhale, PM 2.5 is so small that it can make its way into the lungs and blood cells once inside the body.
Breath in, breath out
Returning to London for the first time in decades, the change in air was intangible. I knew it was worse but didn’t feel it was worse, like being forced to unknowingly smoke without seeing the exhale.
Long term exposure to Particulate Matter increases the risk of lung and heart complications, with the International Agency for Research on Cancer (IARC) classifying it as carcinogenic and contributing to lung cancer.
It has long been known that such pollution can exacerbate existing health conditions such as asthma but according to the UK government there is emerging research showing associations with dementia, low birth-weight, stunted lung growth in children and Type 2 diabetes.
In 2013, Ella Kissi-Debrah suffered her last asthma attack after 27 hospital admissions and 6 different consultants, her parents unaware of the things that floated in the air they lived in.

How polluted was your city in 2019?
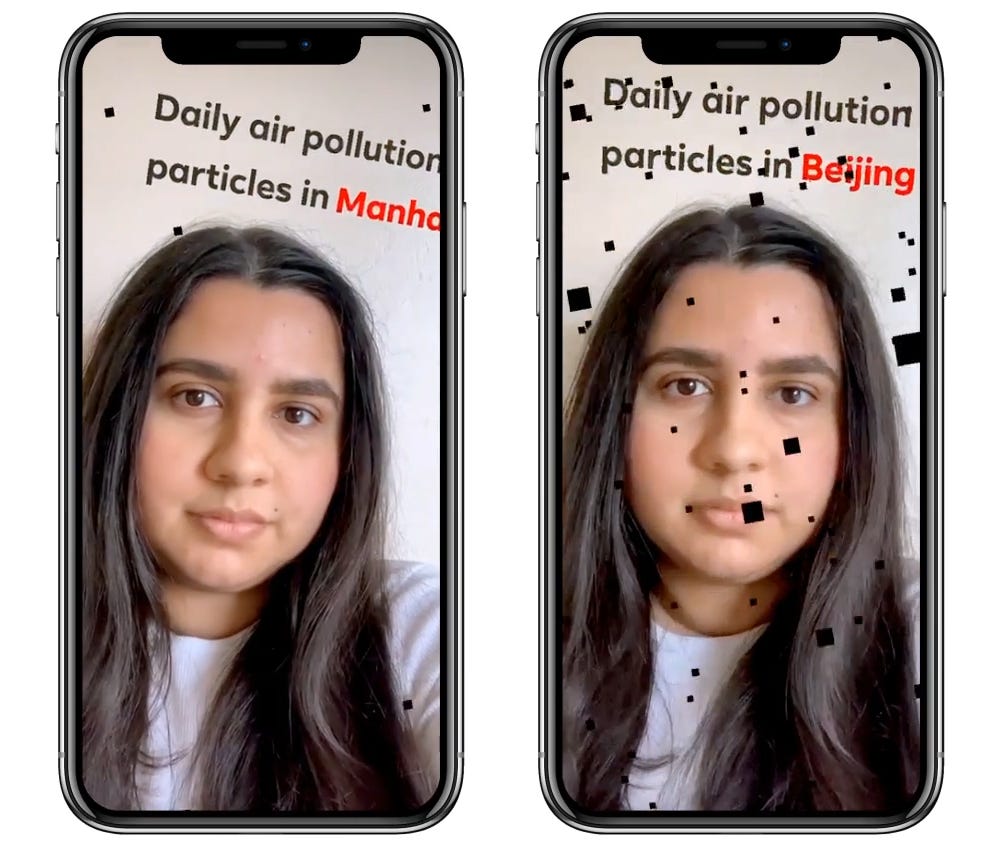
The New York Times have an interactive from 2019 that shows the levels of PM 2.5 on the worst day of your location. It’s from this dataset that I expanded my idea to visualise the air in AR through Instagram.
In 2019, on its worst day London air was actually almost 50% more polluted with PM 2.5 than Manhattan was on its worst day of the year.
Delhi reigns top of the scale with 988µg/m3 of fine particulate matter recorded in a single day putting it in the “extreme” category as classified by the United State Environmental Protection Agency. Currently the UK government has no clear guidelines on safe levels of PM 2.5.
Try the AR filter out on The Dive’s instagram page here. Click on the story called City Air AR and try the filter in the top left corner of the story.
Use the Instagram filter to see how much PM 2.5 you could be inhaling across different cities and tag @thedivenewsletter so I can see how you’re experiencing the filter.